 Documentation
Navigation
Viewer layout
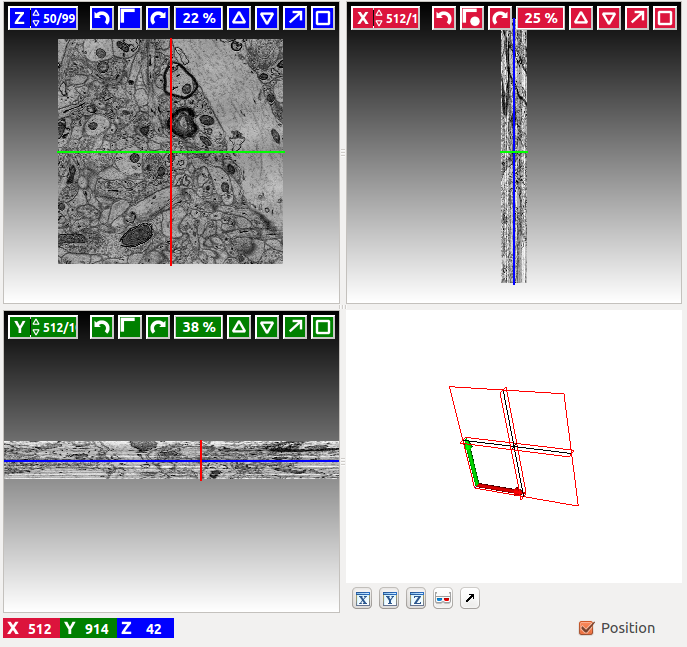
Most applets include a data viewer component in the lower right corner of ilastik’s main window, like the one shown below:
The data is shown using three orthogonal slicing planes. The x-view (red) shows y,z-slices, the y-view (green) shows x,z slices and the z-view (blue) shows x,y-slices.
The red, green and blue lines indicate the current position (given by the slicing position of the three planes). These lines can be hidden with the Position checkbox in the lower right.
In the lower left, the current coordinate under the mouse are shown.
Navigation Overlay
In each of the three slice views, there is an overlay dedicated to navigation at the top. The x-view has a red color, y-view has a green color and the z-view has a blue color.
-
 Navigate to a particular slice number.
Click into the spin box and type in a new slice
position.
 -
 The arrows rotate this view by 90 degrees left or right.
The button in the middle swaps the two axes.
 -
 Indicates the current zoom percentage.
 -
 Zoom to fit (show the entire slice) and reset the zoom level to
100%.
 -
 Dock the slice view out of the application window. The view
becomes its own window, which can be moved to a second monitor for example.
To dock the view back into ilastik’s main window, click the arrow again.
 -
 Maximize the slice view. The other two slice views will be hidden.
Clicking this button again restores the original layout.
Mouse & Keyboard
- Use the Mouse wheel to scroll forward/backward through the stack represented by the slice view
- Hold Ctrl ( Cmd on Mac OS X) while using the mouse wheel to zoom in/out (if the cursor is over one 2D slicing plane, the respective plane is zoomed, otherwise all 3 slicing planes are zoomed simultaneously)
- Hold Shift while using the mouse wheel to browse a time sequence
- Pan the view by dragging the mouse while pressing shift OR the middle mouse button pressed
- jump to a new 3D position by double clicking
3D view
-
 toggle the visibility of
x, y or z slicing planes. Often, because the planes are draggable,
they hinder the interaction with the data or make it difficult to rotate
the view.
 -
 Toggle anaglyph (needs red/blue glasses) rendering.
 -
 Dock the 3D view out of ilastik’s main window (for example to move it to
another screen). Another click docks the window back.


